
Page 6 - Connecting Media, Technology And Brands To Tomorrow's Consumer
P. 6
Section 01
Highlights // INTRODUCTION
HIGHLIGHTS
INTRODUCTION
BrandZTM Global Top 100 increases 14 percent in value to $3.3 trillion
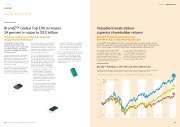
Valuable brands deliver superior shareholder returns
BrandZTM Portfolio outperforms the
S&P 500 Index and the MSCI World Index
The BrandZTM Strong Brands Portfolio increased 102.6 percent over 10 years, between April 2006 and April 2015, outperforming both the S&P 500, which grew 63 percent, and the 30.3 percent gain of the MSCI World Index, a weighted index of global stocks.
Value rises 126 percent during past decade, despite market turbulence
The BrandZTM Top 100 Most Valuable Global Brands 2015 increased 14 percent to $3.3 trillion in total Brand Value, its highest level ever, following a 12 percent rise a year earlier.
Over the 10 years since WPP launched the BrandZTM Global Top 100 in 2006, total Brand Value rose 126 percent. The Asia- Pacific region now generates almost one- fifth of that value, and China alone accounts for 13 percent, although North America still comprises two-thirds.
Reflecting the growth octane of high-value brands, even through disruptive periods,
an average of only four or five brands per year entered or dropped out of the ranking between 2006 and 2015, 42 brands in total.
Five categories outperformed the BrandZTM Top 100 in brand value growth during the
10 years since the BrandZTM Global Top 100 ranking began. Fast food rose 252 percent in brand value; beer, 183 percent; technology, 175 percent; apparel, 139 percent; and telecom providers, 136 percent.
The technology and retail categories led the year-over-year brand value rise in
the 2015 BrandZTM Global Top 100, with both increasing 24 percent. Insurance and telecom providers also experienced strong value growth, 21 percent and 17 percent, respectively. Two categories declined – global banks and luxury – and apparel remained even year-on-year. In addition:
• Apple displayed remarkable brand strength, returning to the number
one position in the ranking based on consumer regard for the brand and its devices. The brand’s iPhone 6 success contributed to an $18 billion quarterly net profit, the largest quarterly profit for a public company ever recorded.
• The Chinese e-commerce brand Alibaba entered the BrandZTM Top 100 for the first time, rising immediately to first place in the retail category, following its record breaking IPO, which raised $25 billion on the New York Stock Exchange.
• Facebook’s brand value almost doubled. The 99 percent increase followed a 68 percent rise a year earlier. The other top risers in brand value included Apple, up 67 percent and Intel, up 58 percent.
These category and brand value fluctuations in the BrandZTM Global Top 100 2015 reflect the dominance of technology as well as
the impact of other trends and disruptive forces, including greater frugality and the uncertainty of geopolitical events like the drop in oil prices and economic sanctions against Russia.
The strong performance of the BrandZTM Strong Brands Portfolio, relative to two well-regarded indexes, affirms that valuable brands deliver superior returns in a sustained way over time and despite significant
market disruptions. It also demonstrates the positive return on money invested to build meaningfully different salient brands.
In concrete terms, $100 invested in the 2006 would be worth $130 today based on the MSCI World Index growth rate, and $163 if it grew at the same pace as the S&P 500. That $100 invested in the BrandZTM Strong Brand Portfolio would more than double in value to $203.
10 BrandZTM Top 100 Most Valuable Global Brands 2015
11
BrandZTM Portfolio vs S&P 500 and MSCI World Index
The BrandZTM Strong Brands Portfolio increased 102.6 percent over 10 years, between April 2006 and April 2015, outperforming both the S&P 500, which grew 63 percent, and the 30.3 percent gain of the MSCI.
The BrandZTM Strong Brands Portfolio is a subset of the BrandZTM Top 100 Most Valuable Global Brands
102.6%
63%
30.3%
100%
80%
60%
40%
20%
0%
-20%
-40%
BrandZTM Strong Brands Portfolio S&P 500
MSCI
-60%
April 2006
April April 2007 2008
April 2009
April 2010
April 2011
April 2012
April 2013
April 2014
April 2015
